CLUE
Overview
The CLUE project dealt with end-to-end trace analytics for software debugging. The project is an amalgmation of several different approaches which we used to stitch event traces together to figure out transaction paths in distributed applications, and their performance.
The main challenge for CLUE was to take massive traces in distributed systems, with limited or no application information and deliver a fast-analytic tool for performance diagnosis
Broadly the following sub-projects were a part of the CLUE tool suite:
- CLUE + AppDiff( system calls and kernel event traces were stitched together to create end-to-end transactions, data mining techniques were used on these transactions to find outliers and anomalies)
- introPerf ( stack unrolling for user-space functions from kernel events to infer performance bugs)
- Border Line Tracing (tracing user-space dynamic library calls and using them to stitch events)
- iProbe (hybrid (static+dynamic) instrumentation tool)
- mTrace
Background: Kernel Event Driven System Monitoring
- Kernel events represent an application’s interaction with the host system.
- They are well-defined events
- Independent of applications so can be applied to everything running on the OS
- Localizing unusual events and making them comprehensible is an important step for performance diagnosis of cloud systems.
The post below is a high level overview of the CLUE project, for better understanding of the technology please have a look at the various publications associated with the project.
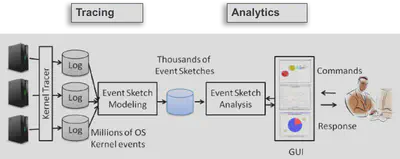
Event Sketching Modeling
CLUE technology was based on “event sketching”, which was a way to group kernel event sequences which had a causal relationship with each other thereby making a complete transaction.
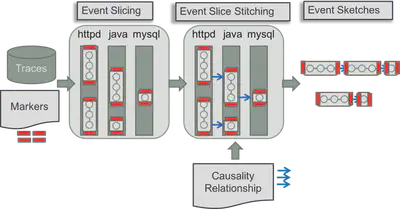
Broadly execution sketching does the following:
- Extract event sketches, groups of kernel event sequences having causality relationship.
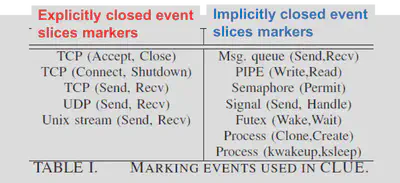
- Explicitly closed event slices
- Event sequence formed on the basis of request-reply communication patterns.
- Implicitly closed event slices
- Event sequence formed on the basis of general producer/consumer communication patterns such as IPCs.
Event slice mark is a 4-tuple record:
- Begin event type: the event type that the first event of an event slice must exactly match.
- End event type: the event type that the last event of an event slice must exactly match.
- Owner filter: the owner ID that the first and last events of an event slice must (partially or exactly) match.
- Event data filter: the event data that the first and last events of an event slice must (partially or exactly) match.
A causality relationship then defines relationship between causal events. One causality relationship is presented as a 5-tuple record:
- Causing event type: a type of events that can cause the occurrence of other events.
- Caused event type: a type of events that are caused by other events.
- Time rule: the rule that a causing event type event and a caused event type event can be associated based on their temporal relationships.
- Owner rule: this defines the rule that a causing event type event and a caused event type event can be associated based on their owner IDs.
- Event data rule: this defines the rule that a causing event type event and a caused event type event can be associated based on their event data
Feature Extraction and clustering
We use two kernel event features to infer the characteristics of event sketches in a black box way.
Program Behavior Feature (PBF)
- PBF is a system call distribution vector.
- PBF is used to infer application logics behind the kernel events.
System Resource Feature (SRF)
- SRF is a vector of resource descriptions of system calls.
- e.g., connect : network, stat : file
This was followed by clustering and conditional data mining. To find anomalies, the paper - http://nipunarora.net/publication/clue/